Plot 'rjdemetra3' model
Arguments
- object
a seasonal adjustment model.
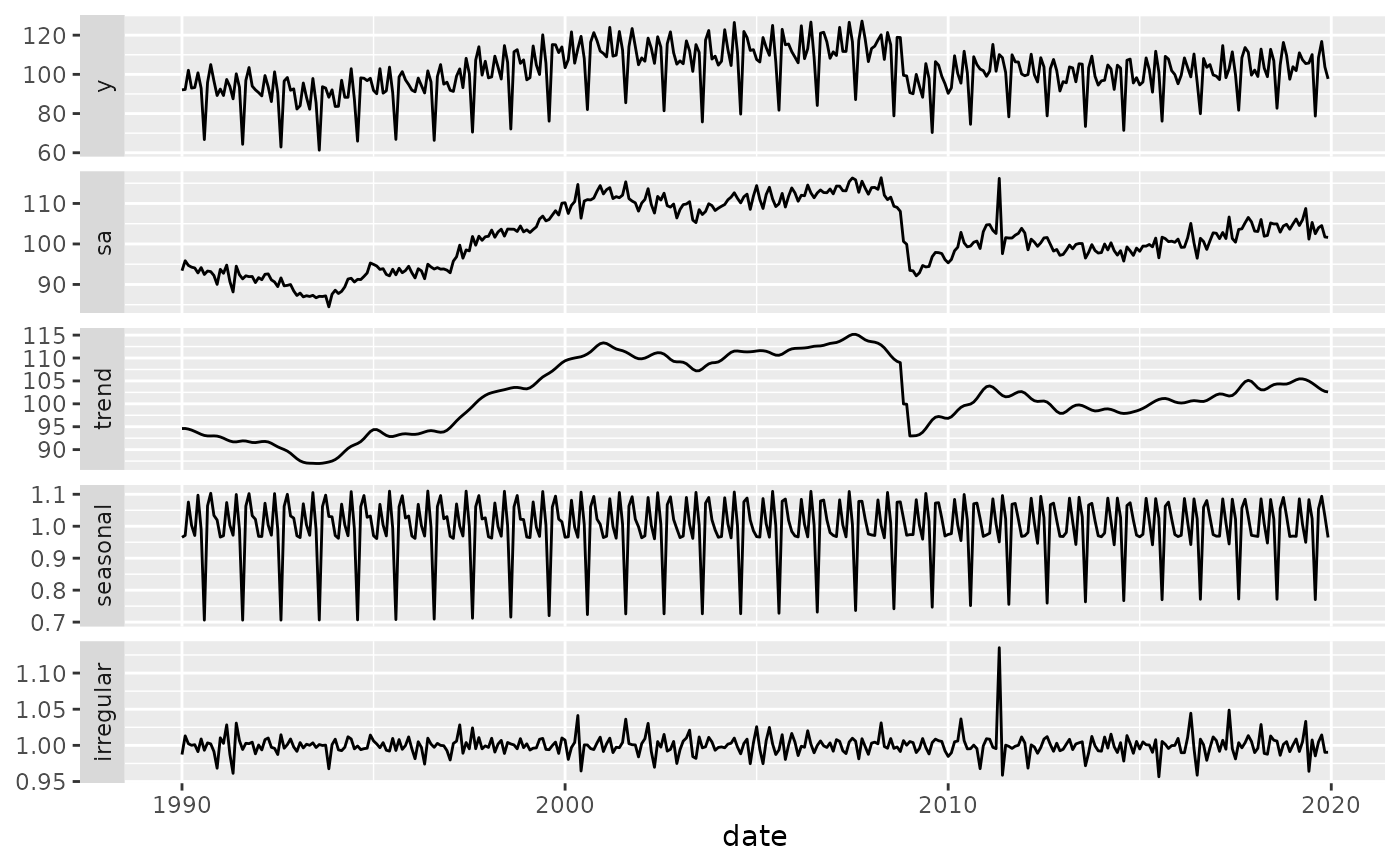
- components
components to print, can be
"y"(input time series),"sa"(seasonal adjusted),"t"(trend-cycle),"y_cal"(calendar adjusted),"s"(seasonal),"i"(irregular),"cal"(calendar). The vector can be named to change the label.- forecast
boolean indicating if the forecast series should be printed.
- ...
unused arguments.