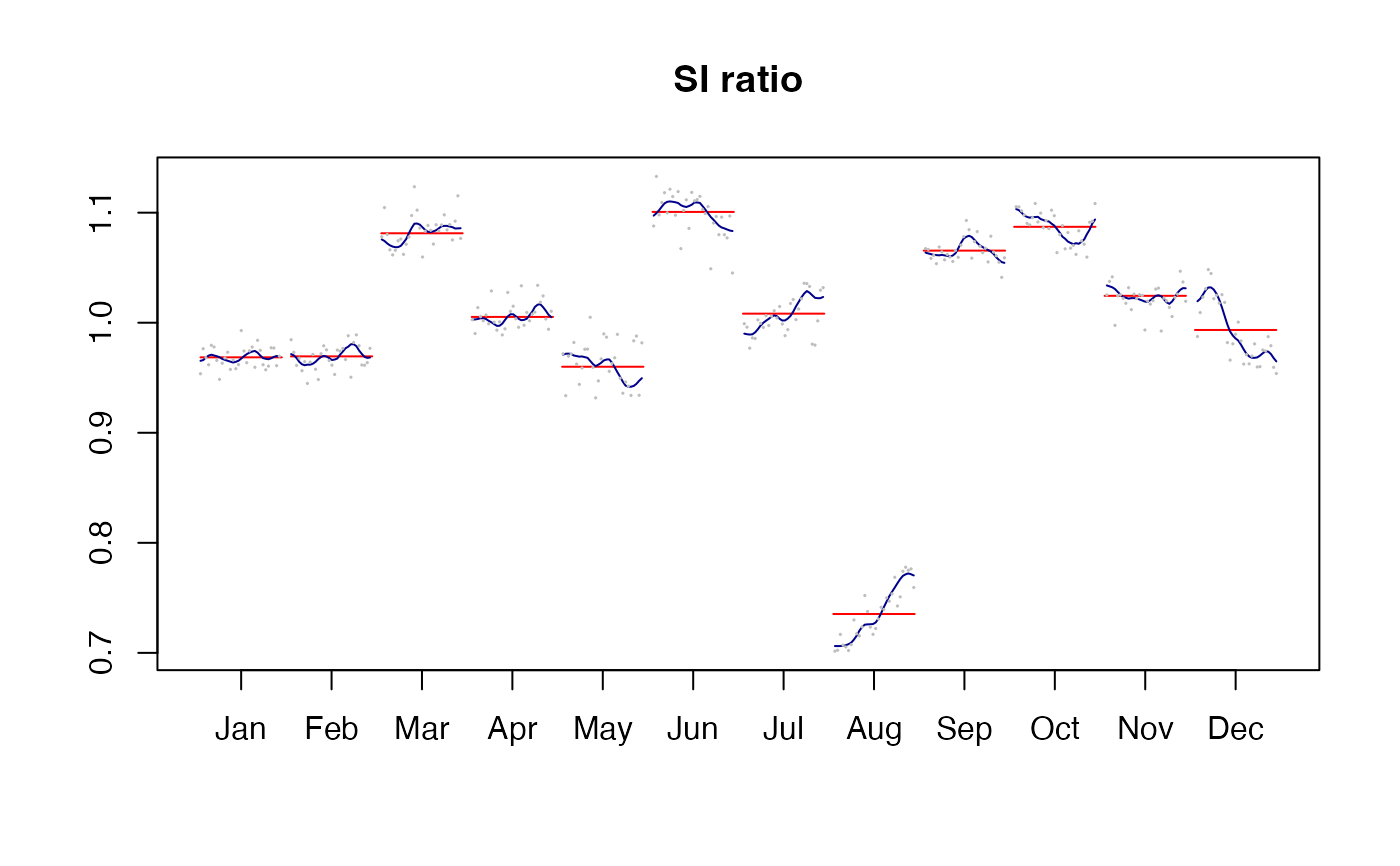
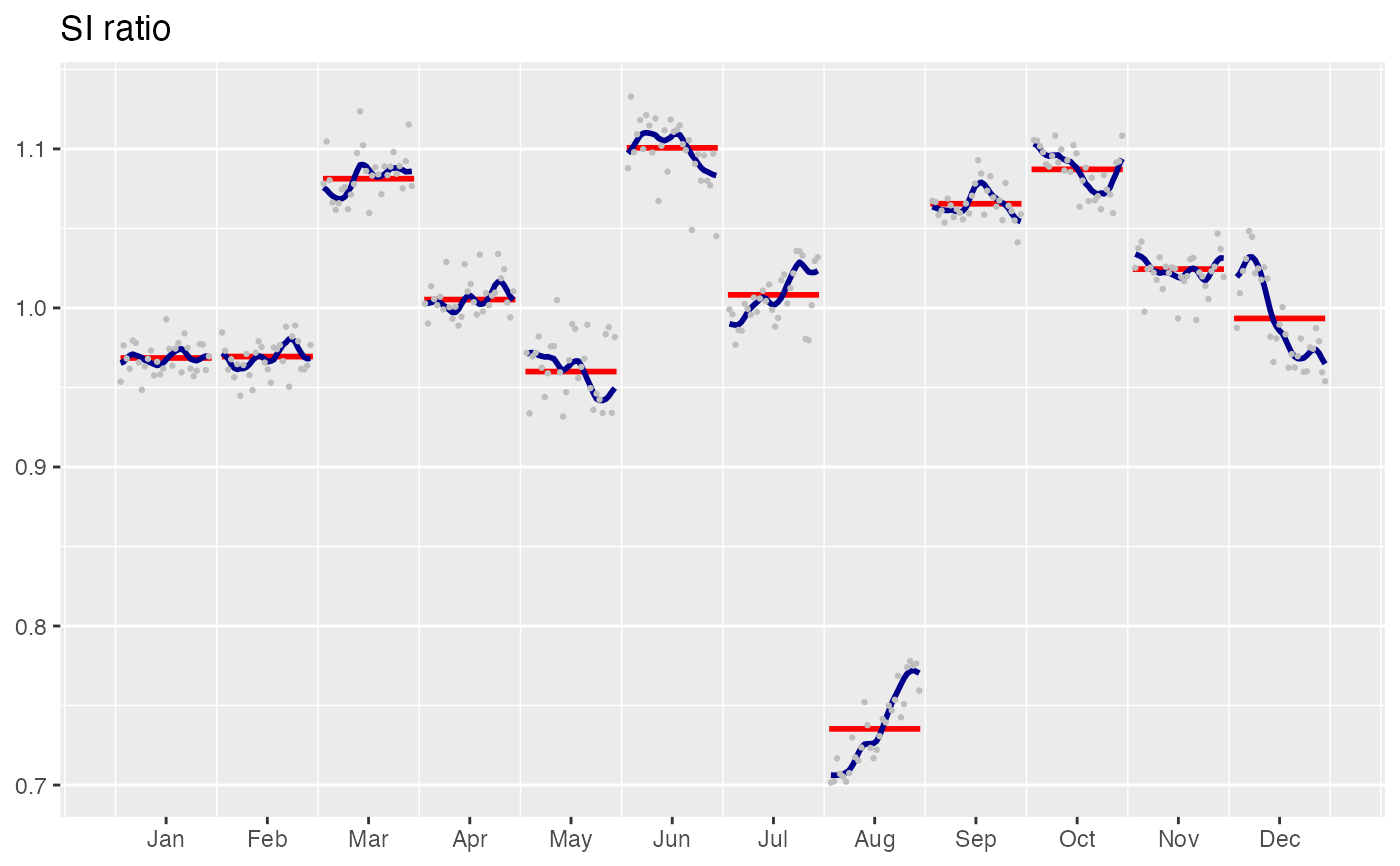
SI-ratio
siratio(x, ...)

siratioplot(
  x,
  labels = NULL,
  add = FALSE,
  box = TRUE,
  col.s = "darkblue",
  col.i = "gray",
  col.mean = "red",
  cex.i = 0.1,
  lwd.s = par("lwd"),
  lwd.mean = lwd.s,
  main = "SI ratio",
  xlab = NULL,
  ylab = NULL,
  xlim = NULL,
  ylim = NULL,
  ...
)

ggsiratioplot(
  x,
  labels = NULL,
  col.s = "darkblue",
  col.i = "gray",
  col.mean = "red",
  cex.i = 0.5,
  lwd.s = 1,
  lwd.mean = lwd.s,
  main = "SI ratio",
  xlab = NULL,
  ylab = NULL,
  ...
)
Arguments
- x
input model or data.
- ...
unused parameters.
- labels
labels.
- add
boolean indicating whether a new plot should be drawn.
- box
boolean indicating a box around the current plot should be drawn.
- col.s, col.i, col.mean
colors of the different components.
- cex.i, lwd.s, lwd.mean
graphical parameters.
- main, xlab, ylab
title, X and Y axis label.
- xlim, ylim
X and Y axis limits.
Examples
x <- rjd3x13::x13(ipi_c_eu[,"FR"])
siratioplot(x)

ggsiratioplot(x)
