Compute data for a simple seasonal adjustment
Source:R/simple_dashboard.R, R/simple_dashboard2.R
simple_dashboard.RdFunctions to compute the data to produce a simple seasonal adjustment dashboard. `simple_dashboard2()` is a slightly variation of `simple_dashboard()` with smaller description text to include a table with last outliers.
simple_dashboard(
  x,
  digits = 2,
  scale_var_decomp = FALSE,
  remove_others_contrib = FALSE,
  add_obs_to_forecast = TRUE,
  td_effect = NULL
)

simple_dashboard2(
  x,
  digits = 2,
  scale_var_decomp = FALSE,
  remove_others_contrib = FALSE,
  digits_outliers = digits,
  columns_outliers = c("Estimate", "T-stat"),
  n_last_outliers = 4,
  order_outliers = c("AO", "LS", "TC", "SO"),
  add_obs_to_forecast = TRUE,
  td_effect = NULL
)
Arguments
- x
a seasonal adjustment model made by 'RJDemetra' (object of class
"SA").- digits
number of digits used in the tables.
- scale_var_decomp
boolean indicating if the variance decomposition table should be rescaled to 100.
- remove_others_contrib
boolean indication if the "Others" contribution (i.e.: the pre-adjustment contribution) should be removed from the variance decomposition table.
- add_obs_to_forecast
Boolean indicating if the last observed values should be added to the forecast table (for the plot).
- td_effect
Boolean indicating if the residual trading days effect test should be printed. By default (`td_effect = NULL`) the test is only printed for monthly series.
- digits_outliers
number of digits used in the table of outliers.
- columns_outliers
informations about outliers that should be printed in the summary table. Can be either a vector of characters among `c("Estimate", "Std. Error", "T-stat", "Pr(>|t|)")`; or an vector of integer: `1` corresponding to the estimate coefficient (`"Estimate"`), `2` corresponding to the standard deviation error (`"Std. Error"`), `3` corresponding to the t-statistic (`"T-stat"`) or `4` corresponding to the p-value (`"Pr(>|t|)"`). By default only the estimate coefficients and the t-statistics are printed (`columns_outliers = c("Estimate", "T-stat")`).
- n_last_outliers
number of last outliers to be printed (by default `n_last_outliers = 4`).
- order_outliers
order of the outliers in case of several outliers at the same date.
See also
Examples
data <- window(RJDemetra::ipi_c_eu[, "FR"], start = 2003)
sa_model <- RJDemetra::jx13(data, "RSA5c")
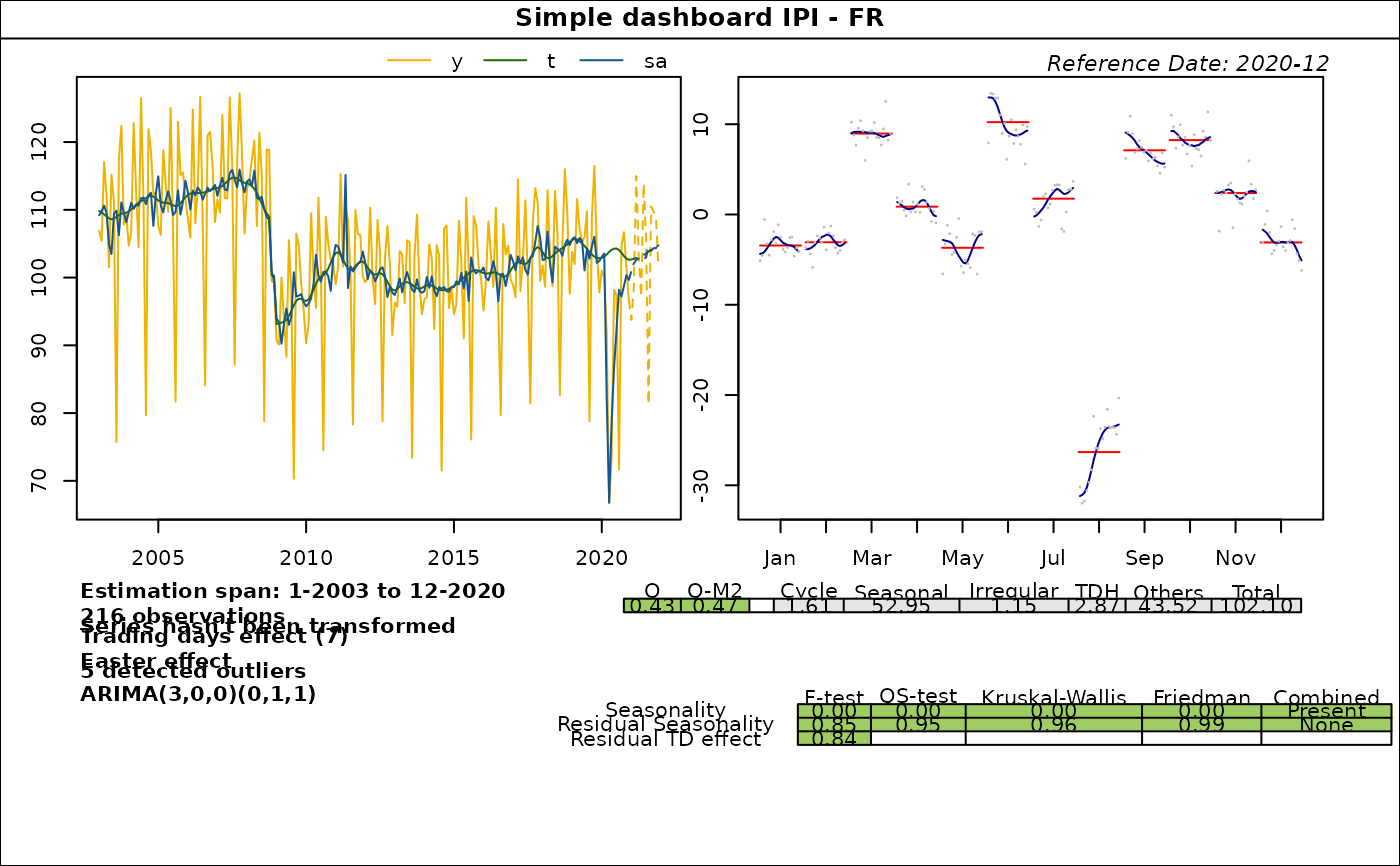
dashboard_data <- simple_dashboard(sa_model)
plot(dashboard_data, main = "Simple dashboard IPI - FR")
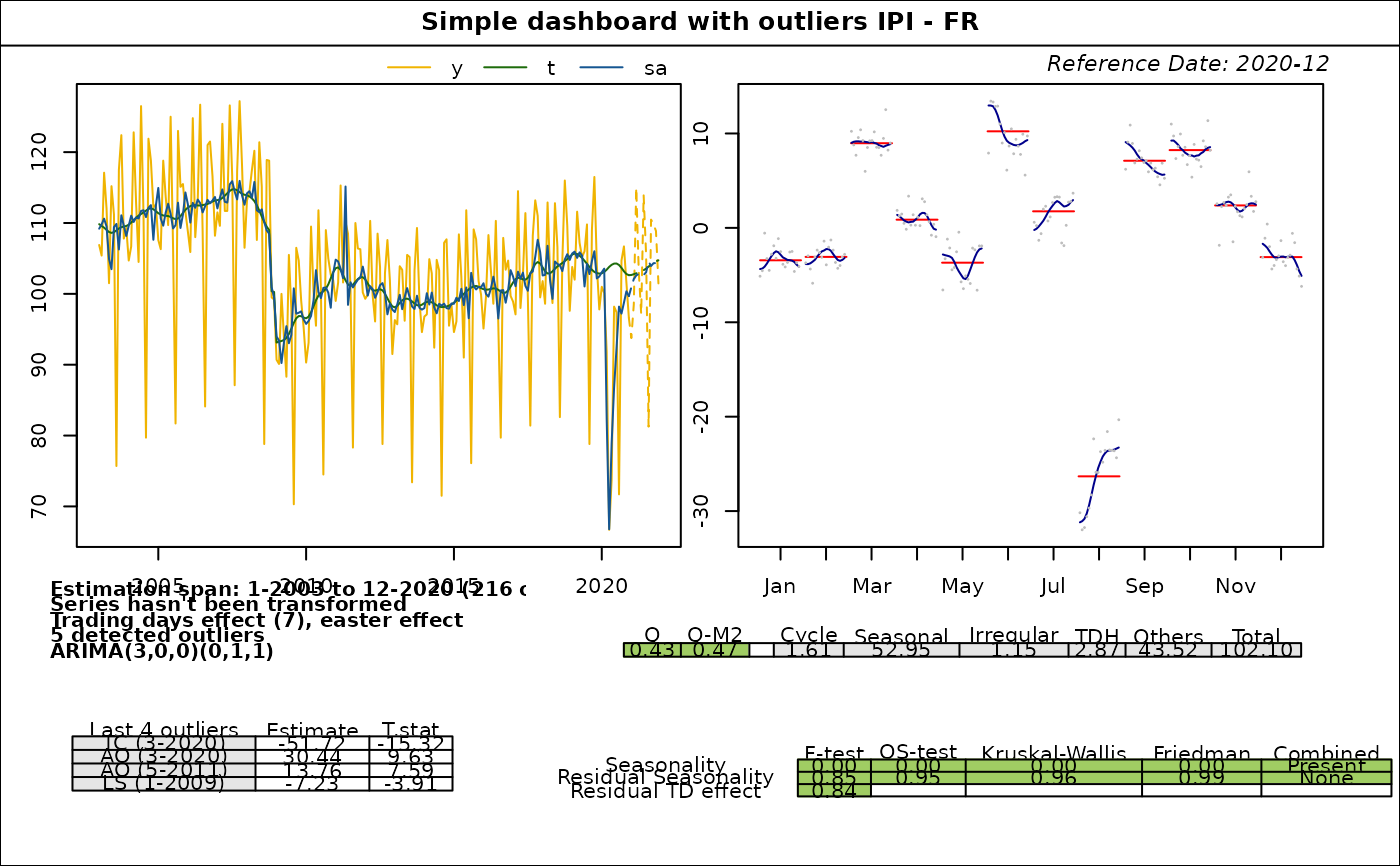
 dashboard_data2 <- simple_dashboard2(sa_model)
plot(dashboard_data2, main = "Simple dashboard with outliers IPI - FR")
dashboard_data2 <- simple_dashboard2(sa_model)
plot(dashboard_data2, main = "Simple dashboard with outliers IPI - FR")